|
|
|
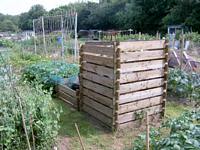
When we heard that our allotment site was to have a metered water supply connected, I had to investigate what the likely cost of water would be and how this would affect annual rents paid by plotholders. The annual rainfall data has enabled me to determine the average rainfall between 1988 and 2020 for this area is 803mm, although it has varied between 532mm and 1186mm. (Standard deviation 163, so most likely range of values 640mm to 966mm per year.) It's likely there is a correlation between rainfall and our water usage, since we will need to use more water in dry seasons than in wet ones, although temperature, wind, humidity, how energetic the plot holders are, will all affect our water usage! Usage varies seasonally, since we would expect to have more crops needing watering, say, from May to October than in February! The aim of this project, therefore, was to record our monthly water usage, then correlate this with monthly rainfall, to try to identify how our usage relates to months of the year and to annual rainfall for that year.
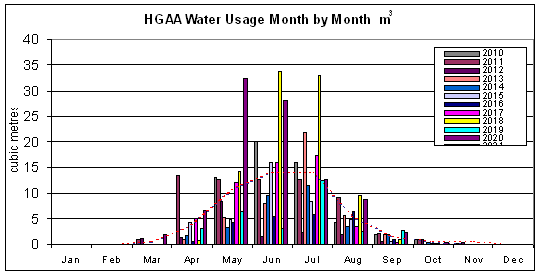
This chart shows our actual water usage from May 2010 to May 2020. The dotted line shows the average usage by month, and totals around 66 cubic metres for our 15 plots, each around 200 sq metres in area. I have attempted to correlate just rainfall and temperature against water usage, but not well enough to publish here!Watch this space... |
| © www.halesowenweather.co.uk email: info@halesowenweather.co.uk |