|
|
|
FLOODING AND DRAINAGE All the precipitation (rain, sleet, snow, hail) which falls must go somewhere. As a grower and gardener, I am interested in my crops and plants getting the right amount of watering. I must ensure that my soil contains an appropriate amount of water for whatever is growing. Too much water in the ground and they will suffer, too little and I will be watering them manually to top up the shortfall. I collect whatever rainwater I reasonably can at home in water butts, 5 in the garden, of which 2 collect rainwater from the greenhouse roof, 1 from the shed roof, 1 from the conservatory roof and 1 from a flat roof over an extension. On my allotment 3 water butts collect rainwater from the shed roof. Water stored in butts from our 763mm of annual rainfall does provide water for a week or so when there is a dry spell, but is not enough to see us through longer dry spells. With metered water supplies becoming more common it is important to conserve and store whatever water we can.
Rainfall Profile - frequency of daily rainfall bands Nearly half the days there is no rain, just
over half have some rain.
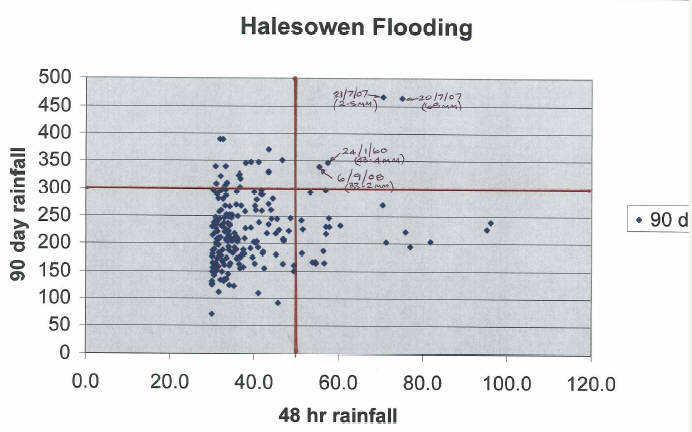
Too much heavy rain at one time means that the ground becomes saturated, then excess water runs off into drains and water-courses. Those who live alongside streams and rivers know what happens if too much water flows into these, and we have been made acutely aware of the possibility of flooding in recent years. Environmental scientists and hydrologists constantly monitor river levels and rainfall, and have models to help them predict when flooding might occur. I supplied local rainfall data to the Environment Agency for 2007 in connection with flooding which occurred in that June and July. On a local level, rainfall I measure in Halesowen will be of local use in helping identify when flooding of local water-courses may be likely. The ground has the ability to hold water, so flooding may be likely when the ground becomes full of water (i.e. the water table becomes very high). This water reservoir will slowly leak away, so it is the balance of water in versus water out which is important. Calculating this is complex since there are so many variables (e.g. area of soil, area of road/pavement/drives/other hard surfaces, type of soil, type of subsoil, depth of soil etc) and the rate of flow of water into and out of the ground is also difficult to quantify. By comparing my rainfall data for Halesowen and dates when local flooding has occurred in recent years, empirical rules may be produced which can be used as an early indicator of possible flooding. Such a rule determined by Martyn Holloway (Dudley MBC) is: if more than 300mm rainfall has occurred in the last 90
days He is keen to point out that it is his theory, and is still open to future refinement. The points in the top right quarter of Martyn's graph correlate with days likely to have flooding.
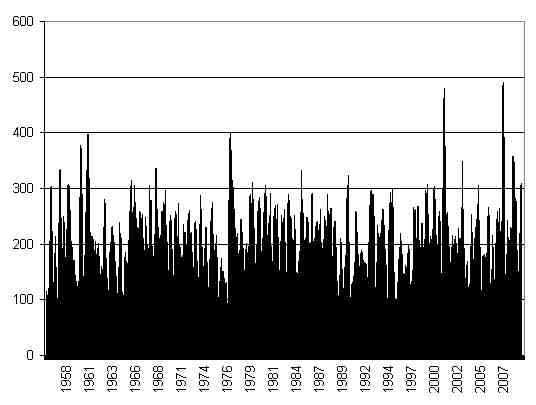
This rule shows good correlation with known local flooding events and near misses. It may need refinement but seems to be a useful rule, and is it is easy to keep an eye on 90 day and 48 hour rainfall amounts. Below is my own version of the 90 day aggregated rainfall
totals from 1956 to 2009 ; 300mm has been exceeded several times. The tallest
spikes on this graph may or may not have also had 50mm rainfall within 48 hours.
HALESOWEN 90 day aggregated rainfall (mm)
|
| © www.halesowenweather.co.uk email: info@halesowenweather.co.uk |