|
|
|
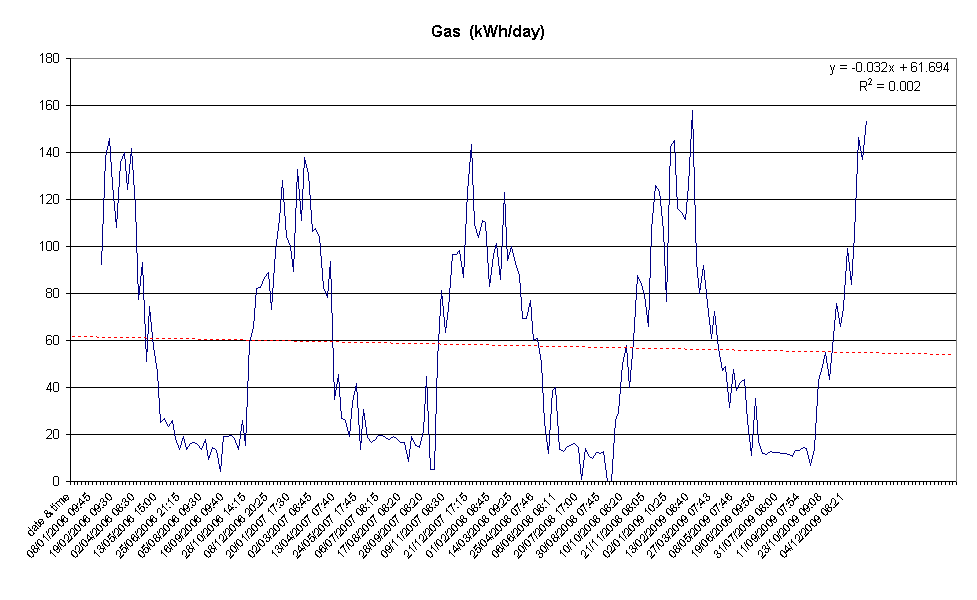
Gas Usage per week Based on our domestic usage of gas, measured each week, showing the seasonal variation, as we use gas for domestic water heating only during the summer, but for both water and central heating in the other months. The gas units read from the meter are converted to kWh per day (this involves multiplying by about 1.6 ). You can see the 5 peaks corresponding to the 5 winters!
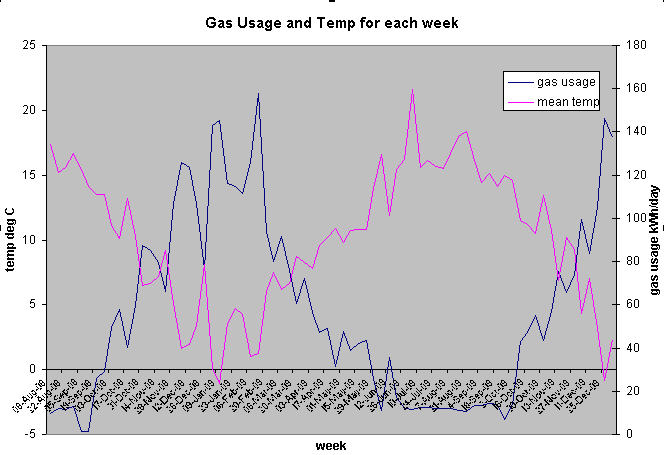
Gas Usage and Mean Temp for each week This graph shows gas usage in kWh/day for each week, and the mean weekly temperature, plotted by date. Clearly one goes up as the other goes down - not unexpected, of course.
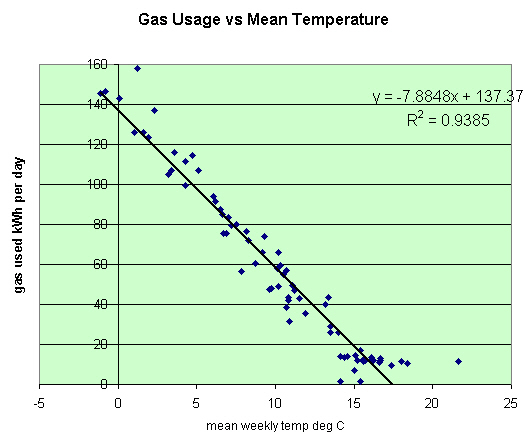
Gas Usage vs Mean Temp scatter graph This step proved to be the most useful breakthrough in Initially I looked at 3 monthly gas bills and plotted usage against 3 monthly mean temperatures, but by noting gas usage weekly instead, I could relate this to weekly mean temperatures, providing a greater number of data points, less dependence on a whole season and more dependence on a weekly snapshot, while not getting involved in reading the gas meter every day which would be tiresome! So weekly data has been used for the last couple of years, and the scatter graph of gas usage (kwh/day) against weekly mean temperature (degC) produces a visualisation which, while not unexpected, shows a surprisingly good correlation. The correlation has indeed been pleasing (although paying the gas bills less so). The graph shows that as mean temp goes down, gas usage goes up, as expected, but the variation is quite linear. Look more closely and it is apparent that, once the temperature gets to 15degC and above, gas usage becomes around a constant 12 kWh/day, corresponding to our gas usage for domestic hot water and cooking only as the central heating would not be on when it is warmer. Once the temperature drops below about 15degC the heating tends to be switched on, at least for part of the day, and as it gets progressively colder, more radiators have their thermostatic valves turned up a notch, for more hours, and is even ticking over at night albeit at a lower setting when the need arises. So the general shape of the scatter graph fits in with what one might have expected would happen. I guess if we were to be really technical about it, we might start thinking along the lines of heat losses being proportional to temperature difference, so imaging our house as a "black box", then heating usage would naturally be sort of proportional to how far the mean temperature is below the 15degC threshold. But I'm happy to have produced a surprisingly linear graph without getting that technical about it!
A final point worth stating is that when we upgraded our gas boiler from a 1980's model to a 2007 model, the graph remained linear, but was pleasingly lower, reflecting the greater efficiency of the new system. Our gas usage is now about 78% of its previous value in colder times when the central heating is on as well as water and cooking, improving to 49% of its original value when gas is only used for water and cooking. Since the "hot water cylinder" disappeared with the new system, we no longer pay for having a tank of hot water sitting around constantly cooling down! UPDATE Jan 2021 A lot more data ( gas usage and mean weekly temperature) has been added to the early version of the graph shown above, and the current working graph is shown below. Data since the new boiler is the blue blobs, and the line of best fit is the blue curvy one. Points with higher temperature (to the right
of the graph) will be summer temperatures, when gas is used to provide hot water
but not central heating, explaining why the curve flattens off at around 10
units.
|
| © www.halesowenweather.co.uk email: info@halesowenweather.co.uk |