Increasing Halesowen temperatures 1956 - 2020
Clearly a slow but steady rise in
temperature over the 65 years from 1956 - 2020...
The line of regression/best fit for the linear trend line of the yellow Mean
temperatures gives
temp = 0.0323 x (years since 1956) + 8.663
so in 1965 the trend line was 8.7C
but in 2020 it was 10.7C
That's 1 degree rise every 31
years...
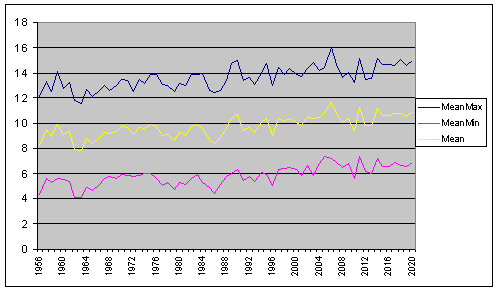
Highest max temperatures - 17 out of 20 have been in recent
years
If the rising trend continues, we
might expect this record to be broken quite often in future...
| 35.6 |
31 |
7 |
2020 |
| 35.1 |
25 |
7 |
2019 |
| 34.9 |
12 |
8 |
2020 |
| 34.9 |
19 |
7 |
2006 |
| 34.8 |
2 |
7 |
2006 |
| 34.7 |
3 |
8 |
1990 |
| 34.5 |
17 |
7 |
2006 |
| 34.4 |
1 |
7 |
2015 |
| 34.2 |
11 |
8 |
2020 |
| 34.1 |
18 |
7 |
2006 |
| 34.1 |
19 |
7 |
2016 |
| 33.8 |
19 |
6 |
2017 |
| 33.3 |
25 |
7 |
2006 |
| 33.1 |
9 |
8 |
2003 |
| 33.0 |
2 |
8 |
1990 |
| 33.0 |
7 |
8 |
2020 |
| 32.9 |
3 |
7 |
2006 |
| 32.9 |
25 |
6 |
2018 |
| 32.8 |
29 |
6 |
2019 |
| 32.6 |
1 |
8 |
1995 |
Increasing Halesowen temperatures rainfall 1956 - 2020
I've got my eye on the rainfall 2011 -2016,
which in a short space of time has embraced both the highest and the lowest
annual rainfall totals here.
The mean annual rainfall shows signs of increasing
over the past decade...
The linear trend line for annual rainfall is
rainfall = 2.1087 x (years since
1956) +
so in 1965 the trend line was at
716.1mm per year
but in 2020 it was at 851.1mm per year
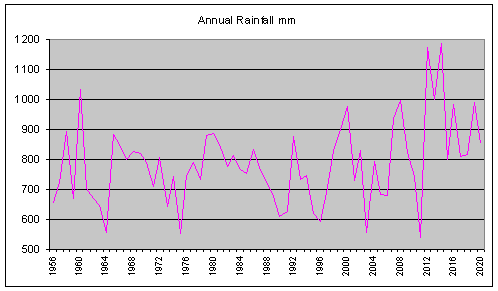
Greatest Annual rainfall - 8 out of the 9 years with
highest annual rainfall have been since 2000
| Year |
Annual
Rainfall mm |
| 2014 |
1186.1 |
| 2012 |
1174.8
|
| 1960 |
1033.7 |
| 2013 |
999.1 |
| 2008 |
997.0 |
| 2019 |
988.3 |
| 2016 |
981.4 |
| 2000 |
977.0 |
| 2007 |
938.4 |
Only 3 of the years with top 20 snowfall have been since
2000
| Year |
Annual
Snow cm |
| 1979 |
95.8 |
| 1981 |
83.5 |
| 1970 |
64.0 |
| 1987 |
56.0 |
| 2013 |
54.3 |
| 1960 |
54.0 |
| 2010 |
52.5 |
| 1956 |
51.0 |
| 1963 |
49.0 |
| 1968 |
44.5 |
| 1964 |
41.0 |
| 1985 |
40.5 |
| 1969 |
39.0 |
| 1965 |
36.0 |
| 1978 |
34.7 |
| 1996 |
34.0 |
| 1982 |
33.7 |
| 1959 |
33.0 |
| 2017 |
32.9 |
| 1986 |
32.5 |
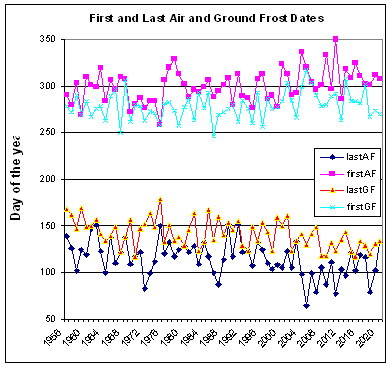
Frosts
The number of days experiencing air frosts and ground frosts
has decreased, as you would expect if temperatures are steadily rising...

Dates
of last spring and first autumn air frosts and ground frosts
Day
of year is 0 = 1st January, 365/366 = 31st December
You
can observe that the last spring frosts (of both kinds) are happening
earlier,
and have drifted earlier by several weeks during these 65 years on average.
Likewise, the first autumn frosts are happening late, by a slightly smaller
amount it seems.
So the average growing season of frost free days is now longer by just over a
month!
This table
shows 10 day slices throughout the year, and tells us how many years out
of 65 there has been an air or ground frost in that slice.
The slice(s) where there is a 50-50 chance of there being an air or ground frost
is coloured in blue for air and green for ground/grass frost, so is a sort of
"average"
| CUMULATIVE |
|
|
|
|
LatestAF |
EarliestAF |
LatestGF |
EarliestGF |
| 10 day slice |
number of years out of 65 that frost
has happened
|
| Mar 1-10 |
1 |
|
|
|
| Mar 11-20 |
2 |
|
|
|
| Mar 21-31 |
7 |
|
|
|
| Apr 1-10 |
11 |
|
|
|
| Apr
11-20 |
25 |
|
0 |
|
| Apr 21-30 |
37 |
|
4 |
|
| May 1-10 |
52 |
|
15 |
|
| May 11-20 |
60 |
|
30 |
|
| May 21-31 |
62 |
|
48 |
|
| Jun 1-10 |
65 |
|
58 |
|
| Jun 11-20 |
SAFE |
|
64 |
|
| Jun 21-30 |
|
|
65 |
|
| Jul 1-10 |
|
|
SAFE |
|
| Jul 11-20 |
|
|
|
|
| Jul 21-31 |
|
|
|
|
| Aug 1-10 |
|
|
|
|
| Aug 11-20 |
|
|
|
SAFE |
| Aug 21-31 |
|
SAFE |
|
0 |
| Sep 1-10 |
|
0 |
|
2 |
| Sep 11-20 |
|
1 |
|
8 |
| Sep 21-31 |
|
3 |
|
21 |
| Oct 1-10 |
|
9 |
|
40 |
| Oct 11-20 |
|
22 |
|
54 |
| Oct 21-31 |
|
37 |
|
60 |
| Nov 1-10 |
|
55 |
|
64 |
| Nov 11-20 |
|
59 |
|
65 |
| Nov 21-30 |
|
62 |
|
65 |
| Dec 1-10 |
|
64 |
|
65 |
| Dec 11-20 |
|
65 |
|
65 |